
Model Visualization
Overview
VisualDL is a toolkit to visualize data generated in deep learning tasks. VisualDL make use of ECharts to display the distribution and change tendency of data, so that users can view data more clearly and intuitively.
To be conductive to analyze the characteristics of data, detect errors, and optimize the neural network model, VisualDL provides seven functional components, including scalar, histogram, image, text, audio, high dimensional and graph.
| Component name | Display chart | Function of component |
|---|---|---|
| scalar | Line Chart | Dynamically display scalar data, such as loss, accuracy, etc. |
| histogram | Histogram | Dynamically display the numerical distribution and change tendency of parameters (such as weight matrix, offset, gradient, etc) |
| image | Image | Dynamically display images, including input images and convolution results, it is conveniently to view the change tendency of intermediate process |
| text | Text | Dynamically display text |
| audio | Audio | Dynamically display audio, users can play directly or choose to download |
| high dimensional | Coordinate | Map high dimensional data into 2D/3D space, for making it easy to observe the correlation of different data |
| graph | Directed Graph | Display the neural networks |
Toolkits of adding data
The six components (scalar, histogram, image, text, audio and high dimensional) are used to add data during program running. Class LogWriter must be initialized before adding data, in order to set the storage path and synchronization cycle. The input parameters of each components will be saved as log file in disk, after that the log file will be loaded into front end to display.
LogWriter
LogWriter is a Python wrapper to write data to log file with the data format defined as in protobuf file record.proto.
The definition of LogWriter :
class LogWriter(dir, sync_cycle)
:param dir : the directory path to the saved log files. :param sync_cycle : specify how often should the system store data into the file system, that is, system will save the data into the file system once operations count reaches sync_cycle. :return: a new LogWriter instance.
Demo 1. Create a LogWriter instance
# Create a LogWriter instance named log_writer
log_writer = LogWriter("./log", sync_cycle=10)
class LogWriter include the following member functions:
mode()scalar(),histogram(),image(),text(),audio(),embedding()
The member function mode() is used to specify the phase of program running. The input string is customized, such as test, validation, test, conv_layer1. Components with same mode are grouped together, so users can choose different modes to display on the frontend webpage.
The member functions scalar(), histogram(), image(), text(), audio() and embedding() are used to create component instance。
Demo 2. Use LogWriter instance to create component instance
# Set the name of mode to "train", and create a scalar component instance
with log_writer.mode("train") as logger:
    train_scalar = logger.scalar("acc")

# Set the name of mode to "test", and create an image component instance
with log_writer.mode("test") as shower:
    test_image = shower.image("conv_image", 10, 1)
scalar -- component to draw line charts
The scalar component is used to draw line charts. By passing scalar data such as loss value, accuracy as input parameters into the scalar() function, the frontend webpage will display the data in the form of line charts. It can facilitate users to grasp the changing tendency of training process.
The first step of using scalar component is initializing the member function scalar() of LogWriter instance, then you can add data through the member function add_record() of ScalarWriter instance.
The member function
scalar()of LogWriter instance :
def scalar(tag, type)
:param tag : The scalar writer will label the data with tag. :param type : Data type, optional choice is limited to “float”, "double", "int", the default setting is "float". :return : A ScalarWriter instance to handle step and value records.
The member function
add_record()of ScalarWriter instance :
def add_record(step, value)
:param step : Step number. :param value : Input data.
Demo 3. scalar demo program GitHub
# coding=utf-8
from visualdl import LogWriter

# Create a LogWriter instance
log_writer = LogWriter("./log", sync_cycle=20)

# Create two ScalarWriter instances, whose mode is set to be "train"
with log_writer.mode("train") as logger:
    train_acc = logger.scalar("acc")
    train_loss = logger.scalar("loss")

# Create a ScalarWriter instance, whose mode is set to be "test"
with log_writer.mode("test") as logger:
    test_acc = logger.scalar("acc")

value = [i/1000.0 for i in range(1000)]
for step in range(1000):
    # Add data
    train_acc.add_record(step, value[step])
    train_loss.add_record(step, 1 / (value[step] + 1))
    test_acc.add_record(step, 1 - value[step])
After running the demo program above, you can start the flask server with command visualdl :
visualdl --logdir ./log --host 0.0.0.0 --port 8080
By opening the URL http://0.0.0.0:8080 in your browser,you will see the interface below.
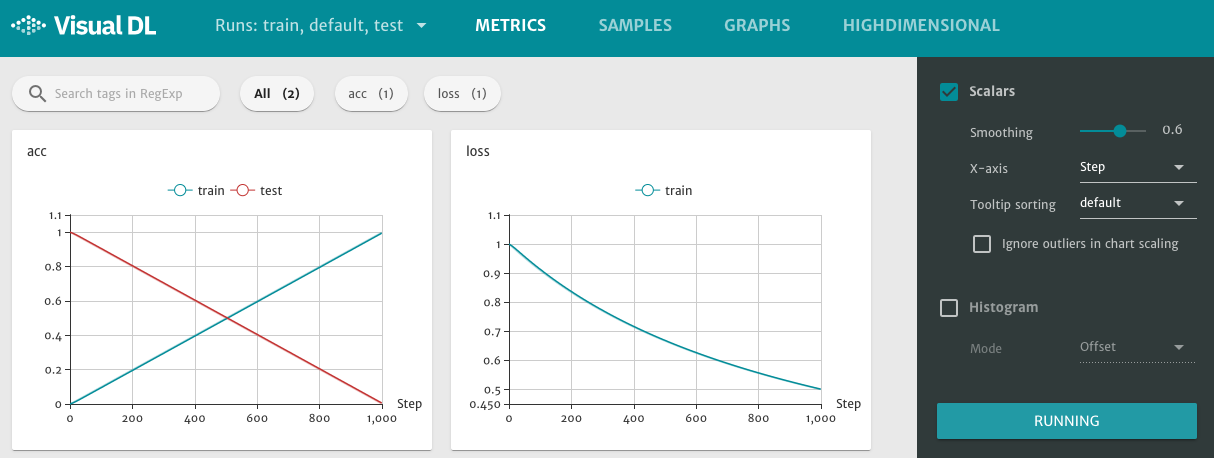
Figure 1. scalar component displays line charts
The right sidebar of VisualDL has adjustment options for each component, take scalar component as example:
Smoothing : To adjust the smoothness of the line charts.
X-axis : The horizontal ordinate of line charts, optional choice : Step, Relative, Wall Time.
Tooltip sorting : Sorting method of tag, optional choice : default, descending, ascending, nearest.
There is also a RUNNING button at the bottom of the right sidebar, the frontend webpage will send request to the flask server for data synchronization. Switching to Stopped, it will pause the data update.
histogram -- component to display data distribution
The histogram component is used to draw histogram for displaying the distribution of input data. By passing some parameters of model training, such as weight matrices, biases, gradient, as input parameters into the histogram() function, the frontend webpage will display the data in the form of histogram. It can facilitate users to view the change tendency of parameters distribution.
The first step of using histogram component is initializing the member function histogram() of LogWriter instance, then you can add data through the member function add_record() of HistogramWriter instance.
The member function histogram() of LogWriter instance :
def histogram(tag, num_buckets, type)
:param tag : The histogram writer will label the data with tag. :param num_buckets : The number of pillar in the histogram. :param type : Data type, optional choice is limited to “float”, "double", "int", the default setting is "float". :return : A HistogramWriter instance to record distribution.
The member function add_record() of HistogramWriter instance :
def add_record(step, value)
:param step : Step number. :param value : Input data, type is list[].
Demo 4. histogram demo program GitHub
# coding=utf-8
import numpy as np
from visualdl import LogWriter

# Create a LogWriter instance
log_writer = LogWriter('./log', sync_cycle=10)

# Create a HistogramWriter instance, whose mode is set to be "train"
with log_writer.mode("train") as logger:
    param1_histogram = logger.histogram("param1", num_buckets=100)

# Loop
for step in range(1, 101):
    # Create input data
    interval_start = 1 + 2 * step/100.0
    interval_end = 6 - 2 * step/100.0
    data = np.random.uniform(interval_start, interval_end, size=(10000))

    # Use member function add_record() to add data
    param1_histogram.add_record(step, data)
After running the demo program above, you can start the flask server with command visualdl :
visualdl --logdir ./log --host 0.0.0.0 --port 8080
By opening the URL http://0.0.0.0:8080 in your browser,you will see the interface below.
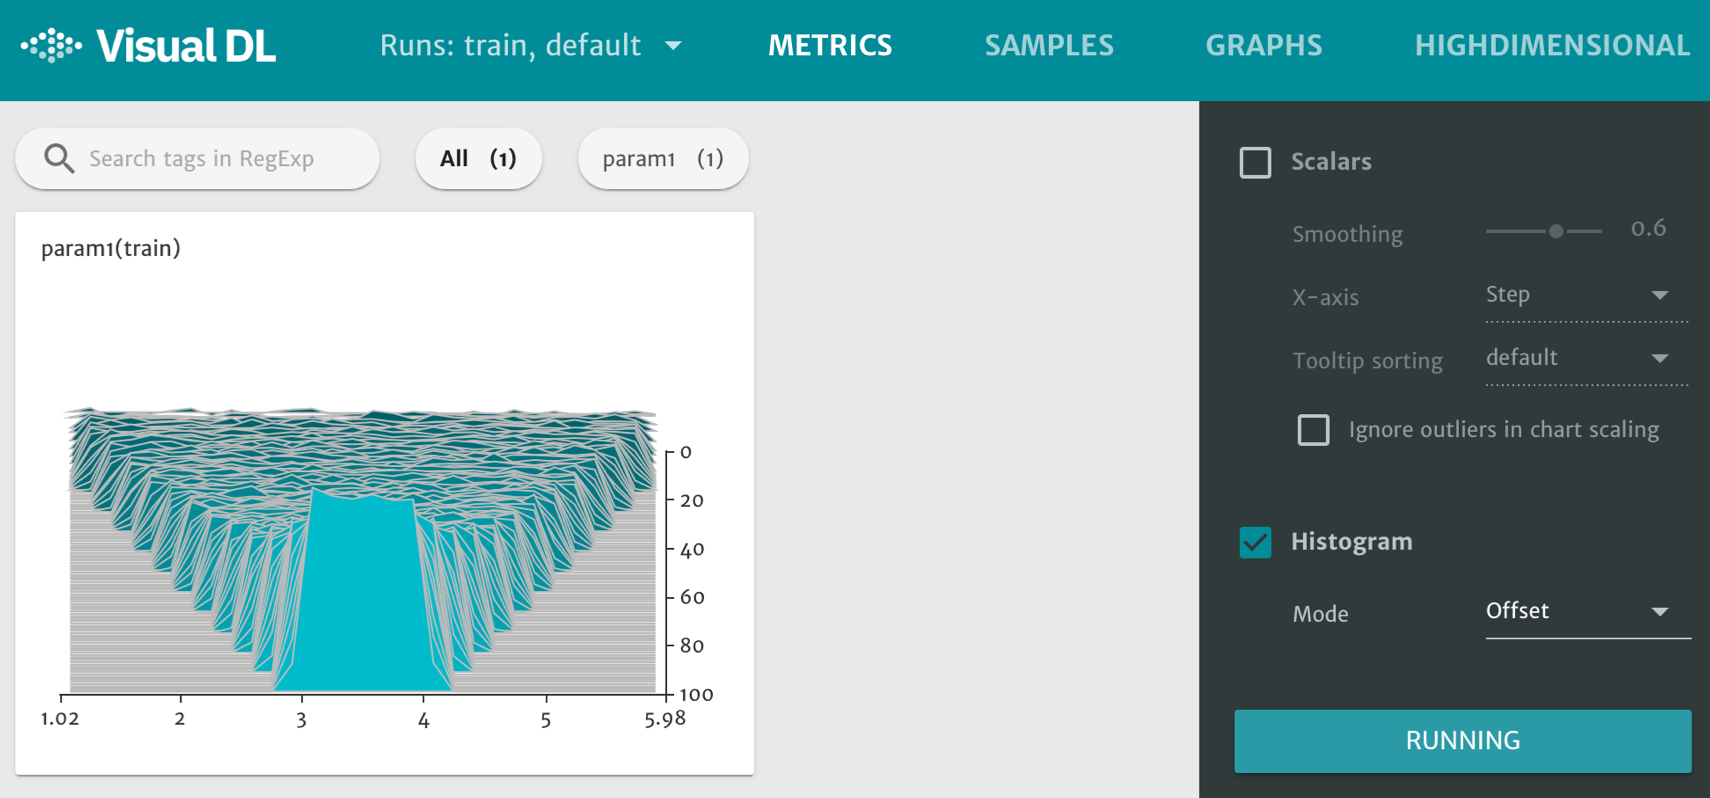
Figure 2. histogram component displays histograms
image -- component to display image
The image component is used to visualize the image data. By passing the image data (type numpy.ndarray) into the image() function, the frontend webpage will display the image directly.
The first step of using image component is initializing the member function image() of LogWriter instance. Then you can add data through the member functions start_sampling(), is_sample_taken(), set_sample(), and finish_sample() of ImageWriter instance.
The member function image() of LogWriter instance :
def image(tag, num_samples, step_cycle)
:param tag : The image writer will label the image with tag. :param num_samples : Appoint the number of samples to take in a step. :param step_cycle : Store every
step_cycleas a record, the default value is 1. :return: A ImageWriter instance to sample images.
Start a new sampling cycle, allocate memory space for the sampled data
def start_sampling()
Determine whether the picture should be sampled or not. If the return value is -1, it means no sampling, otherwise it should be sampled :
def is_sample_taken()
Add image data :
def set_sample(index, image_shape, image_data)
:param index : Combined with tag, used to determine the sub-frame of the image display. :param image_shape : The shape of image, [weight, height, channel(RGB is 3, GrayScale is 1)]. :param image_data : Image data with type numpy.ndarray, member function flatten() can turn the shape to row vector.
End the current sampling period, load the sampled data into disk, and release the memory space :
def finish_sample()
Demo 5. image demo program GitHub
# coding=utf-8
import numpy as np
from visualdl import LogWriter
from PIL import Image


def random_crop(img):
    '''
    This function is used to get a random block (100*100 pixels) of data img.
    '''
    img = Image.open(img)
    w, h = img.size
    random_w = np.random.randint(0, w - 100)
    random_h = np.random.randint(0, h - 100)
    return img.crop((random_w, random_h, random_w + 100, random_h + 100))


# Create a LogWriter instance
log_writer = LogWriter("./log", sync_cycle=10)

# Create a ImageWriter instance
ns = 2
with log_writer.mode("train") as logger:
    input_image = logger.image(tag="test", num_samples=ns)

# The variable sample_num is used to record the number of image data that have been sampled
sample_num = 0

for step in range(6):
    # Set the condition of start_sampling()
    if sample_num == 0:
        input_image.start_sampling()

    idx = input_image.is_sample_taken()
    # if idx != -1,sample this data, otherwise skip
    if idx != -1:
        # Get image data
        image_path = "test.jpg"
        image_data = np.array(random_crop(image_path))

        # Add data
        input_image.set_sample(idx, image_data.shape, image_data.flatten())
        sample_num += 1

        # If sampling of the present period have been completed, call finish_sample()
        if sample_num % ns == 0:
        input_image.finish_sampling()
        sample_num = 0
After running the demo program above, you can start the flask server with command visualdl :
visualdl --logdir ./log --host 0.0.0.0 --port 8080
By opening the URL http://0.0.0.0:8080 in your browser,then click the SAMPLES option at the top of the webpage, you will see the interface below.
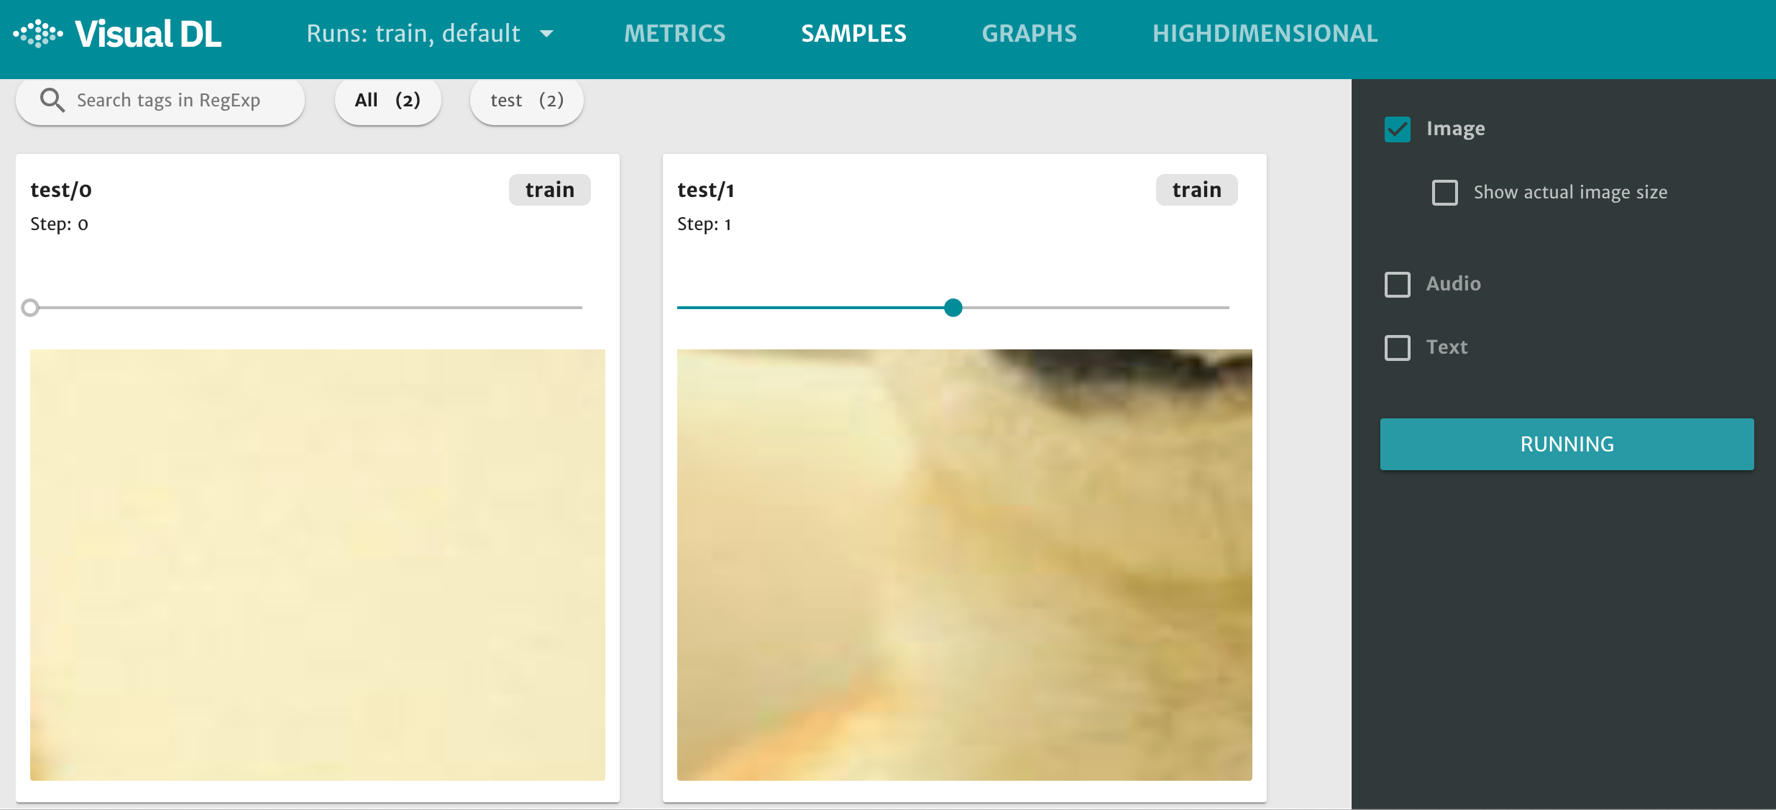
Figure 3. image component displays images
Each subgraph has a horizontal axis which can be dragged to display images of different steps.
text -- component to display text
The text component is used to visualize the text data. By passing the text data (type string) into the text() function, the frontend webpage will display the image directly.
The first step of using text component is initializing the member function text() of LogWriter instance, then you can add data through the member function add_record() of TextWriter instance.
The member function text() of LogWriter instance :
def text(tag)
:param tag : Combined with tag, used to determine the sub-frame of the image display.
The member function add_record() of TextWriter instance :
def add_record(step, str)
:param step : Step number. :param value : Input data, type is string.
Demo 6. text demo program GitHub
# coding=utf-8
from visualdl import LogWriter

# create a LogWriter instance
log_writer = LogWriter("./log", sync_cycle=10)

# Create a TextWriter instance
with log_writer.mode("train") as logger:
    vdl_text_comp = logger.text(tag="test")

# Use member function add_record() to add data
for i in range(1, 6):
    vdl_text_comp.add_record(i, "这是第 %d 个 step 的数据。" % i)
    vdl_text_comp.add_record(i, "This is data %d ." % i)
After running the demo program above, you can start the flask server with command visualdl :
visualdl --logdir ./log --host 0.0.0.0 --port 8080
By opening the URL http://0.0.0.0:8080 in your browser,then click the SAMPLES option at the top of the webpage, you will see the interface below.
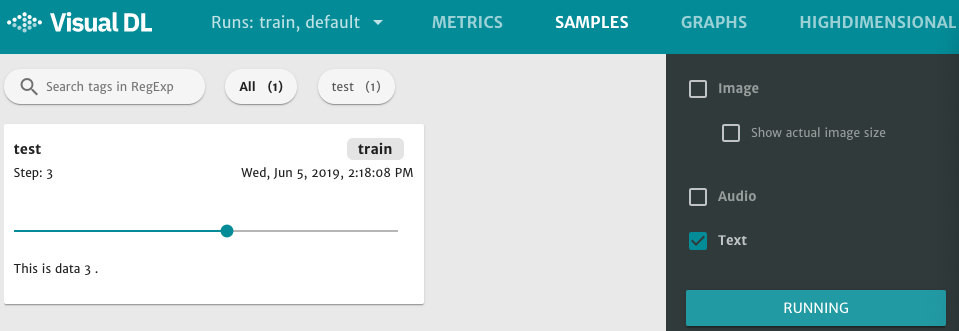
Figure 4. text component displays texts
Each subgraph has a horizontal axis which can be dragged to display text of different steps.
audio -- component to play audio
The audio component is used to play audio. By passing the audio data (type numpy.ndarray) into the audio() function, users can play audio directly, or choose to download.
The first step of using audio component is initializing the member function audio() of LogWriter instance. Then you can add data through the member functions start_sampling(), is_sample_taken(), set_sample(), and finish_sample() of AudioWriter instance.
The member function audio() of LogWriter instance :
def audio(tag, num_samples, step_cycle)
:param tag : The audio writer will label the audio with tag. :param num_samples : Appoint the number of samples to take in a step. :param step_cycle : Store every
step_cycleas a record, the default value is 1. :return: An AudioWriter instance to sample images.
Start a new sampling cycle, allocate memory space for the sampled data :
def start_sampling()
Determine whether the audio should be sampled or not. If the return value is -1, it means no sampling, otherwise it should be sampled :
def is_sample_taken()
Add audio data :
def set_sample(index, audio_params, audio_data)
:param index : Combined with tag, used to determine the sub-frame of the audio. :param audio_params : The parameters of audio, [sample rate, sample width, channels]. :param audio_data : Audio data with type numpy.ndarray, member function flatten() can turn the shape to row vector.
End the current sampling period, load the sampled data into disk, and release the memory space :
def finish_sample()
Demo 7. audio demo program GitHub
# coding=utf-8
import numpy as np
import wave
from visualdl import LogWriter


def read_audio_data(audio_path):
    """
    Read audio data
    """
    CHUNK = 4096
    f = wave.open(audio_path, "rb")
    wavdata = []
    chunk = f.readframes(CHUNK)

    while chunk:
        data = np.fromstring(chunk, dtype='uint8')
        wavdata.extend(data)
        chunk = f.readframes(CHUNK)

    # 8k sample rate, 16bit frame, 1 channel
    shape = [8000, 2, 1]

    return shape, wavdata


# Create a LogWriter instance
log_writer = LogWriter("./log", sync_cycle=10)

# Create an AudioWriter instance
ns = 2
with log_writer.mode("train") as logger:
    input_audio = logger.audio(tag="test", num_samples=ns)

# The variable sample_num is used to record the number of audio data that have been sampled
audio_sample_num = 0

for step in range(9):
# Set the condition of start_sampling()
if audio_sample_num == 0:
    input_audio.start_sampling()

    # Get idx
    idx = input_audio.is_sample_taken()
    # if idx != -1,sample this data, otherwise skip
    if idx != -1:
        # Read audio data
        audio_path = "test.wav"
        audio_shape, audio_data = read_audio_data(audio_path)

        # Add data through member function set_sample()
        input_audio.set_sample(idx, audio_shape, audio_data)
        audio_sample_num += 1

        #  If sampling of the present period have been completed, call finish_sample()
        if audio_sample_num % ns ==0:
            input_audio.finish_sampling()
            audio_sample_num = 0
After running the demo program above, you can start the flask server with command visualdl :
visualdl --logdir ./log --host 0.0.0.0 --port 8080
By opening the URL http://0.0.0.0:8080 in your browser,then click the SAMPLES option at the top of the webpage, you will see the interface below.
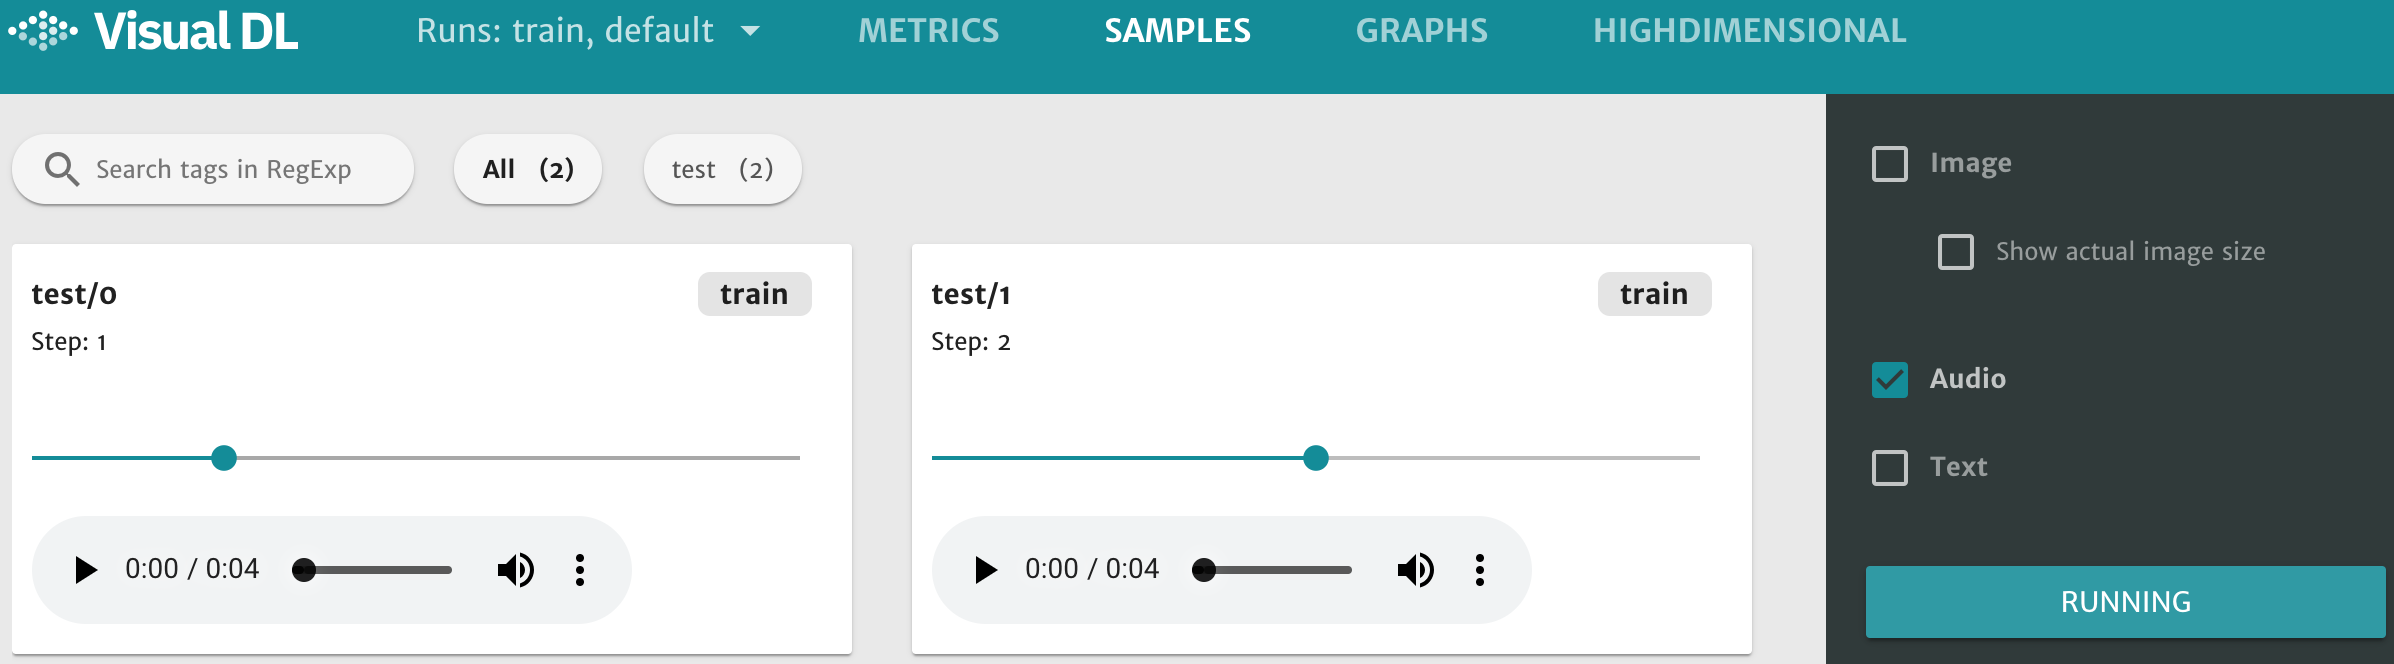
Figure 5. audio component displays audios
Each subgraph has a horizontal axis which can be dragged to play audio of different steps.
high dimensional -- component of dimensionality reduction
The role of high dimensional component is to map data into 2D or 3D space for embedding visualization, which is helpful for users to understand the relevance of different data.
The high dimensional component supports the following two dimensionality reduction algorithms :
PCA : Principle Component Analysis
t-SNE : t-distributed stochastic neighbor embedding
The first step of using audio component is initializing the member function embedding() of LogWriter instance. Then you can add data through the member functions add_embeddings_with_word_dict() of EmbeddingWriter instance.
The member function embedding() of LogWriter instance
def embedding()
The member function add_embeddings_with_word_dict() of EmbeddingWriter instance :
def add_embeddings_with_word_dict(data, Dict)
:param data : input data , type List[List(float)]. :param Dict : dictionary, type Dict[str, int].
Demo 8. high dimensional demo program GitHub
# coding=utf-8
import numpy as np
from visualdl import LogWriter

# Create a LogWriter instance
log_writer = LogWriter("./log", sync_cycle=10)

# Create an EmbeddingWriter instance
with log_writer.mode("train") as logger:
    train_embedding = logger.embedding()

# Initialize data List[List(float)]
hot_vectors = np.random.uniform(1, 2, size=(10, 3))
word_dict = {
    "label_1": 5,
    "label_2": 4,
    "label_3": 3,
    "label_4": 2,
    "label_5": 1,}

# Add data through member function add_embeddings_with_word_dict(data, Dict)
train_embedding.add_embeddings_with_word_dict(hot_vectors, word_dict)
After running the demo program above, you can start the flask server with command visualdl :
visualdl --logdir ./log --host 0.0.0.0 --port 8080
By opening the URL http://0.0.0.0:8080 in your browser,then click the HIGHDIMENSIONAL option at the top of the webpage, you will see the interface below.
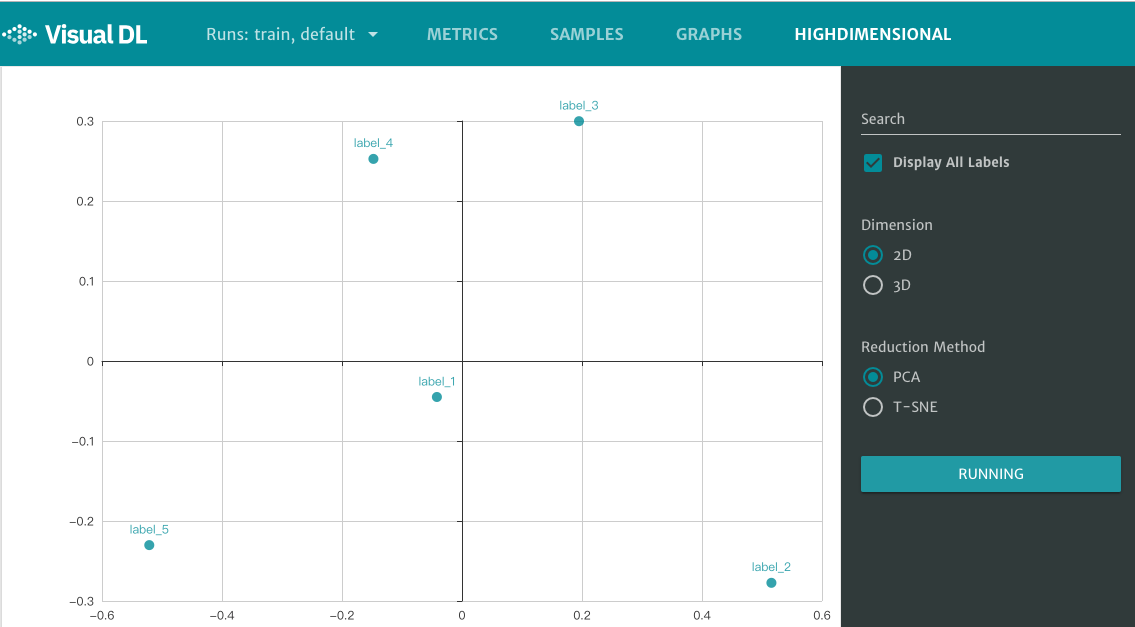
Figure 6. high dimensional component displays plane coordinates
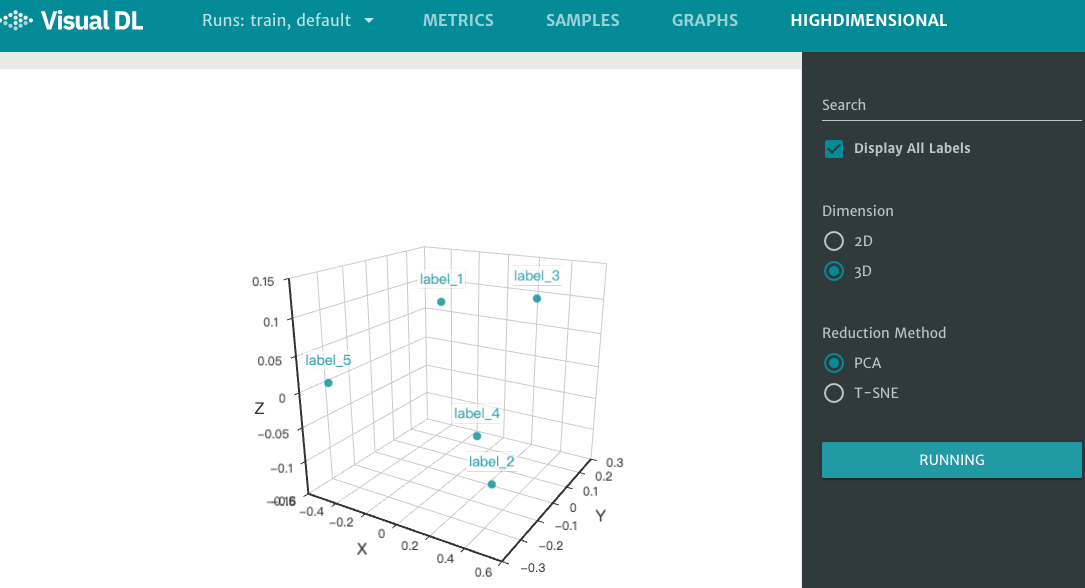
Figure 7. High dimensional component displays Cartesian coordinates
graph -- component to visualize neural network
The role of graph component is to visualize neural network. This component can display models with Paddle format or ONNX format. The graph component can help users understand the model structure of the neural network, and also help to troubleshoot neural network configuration errors.
Unlike other components that need to record data, the only one prerequisite for using graph component is specifying the storage path of the model file. That is, adding the option --model_pb to the command visualdl to specify the storage path of the model file, then you can see the corresponding neural network in the frontend webpage.
Demo 9. graph demo program(How to save a Lenet-5 model by Paddle)GitHub
# coding=utf-8
import paddle.fluid as fluid


def lenet_5(img):
    '''
    Define the Lenet-5 model
    '''
    conv1 = fluid.nets.simple_img_conv_pool(
        input=img,
        filter_size=5,
        num_filters=20,
        pool_size=2,
        pool_stride=2,
        act="relu")

    conv1_bn = fluid.layers.batch_norm(input=conv1)

    conv2 = fluid.nets.simple_img_conv_pool(
        input=conv1_bn,
        filter_size=5,
        num_filters=50,
        pool_size=2,
        pool_stride=2,
        act="relu")

    predition = fluid.layers.fc(input=conv2, size=10, act="softmax")
    return predition


# Variable assignment
image = fluid.layers.data(name="img", shape=[1, 28, 28], dtype="float32")
predition = lenet_5(image)

place = fluid.CPUPlace()
exe = fluid.Executor(place=place)
exe.run(fluid.default_startup_program())

# save the result to "./paddle_lenet_5_model"
fluid.io.save_inference_model(
    "./paddle_lenet_5_model",
    feeded_var_names=[image.name],
    target_vars=[predition],
    executor=exe)
After running the demo program above, you can start the flask server with command visualdl :
visualdl --logdir ./log --host 0.0.0.0 --port 8080 --model_pb paddle_lenet_5_model
By opening the URL http://0.0.0.0:8080 in your browser,then click the GRAPHS option at the top of the webpage, you will see the interface below.
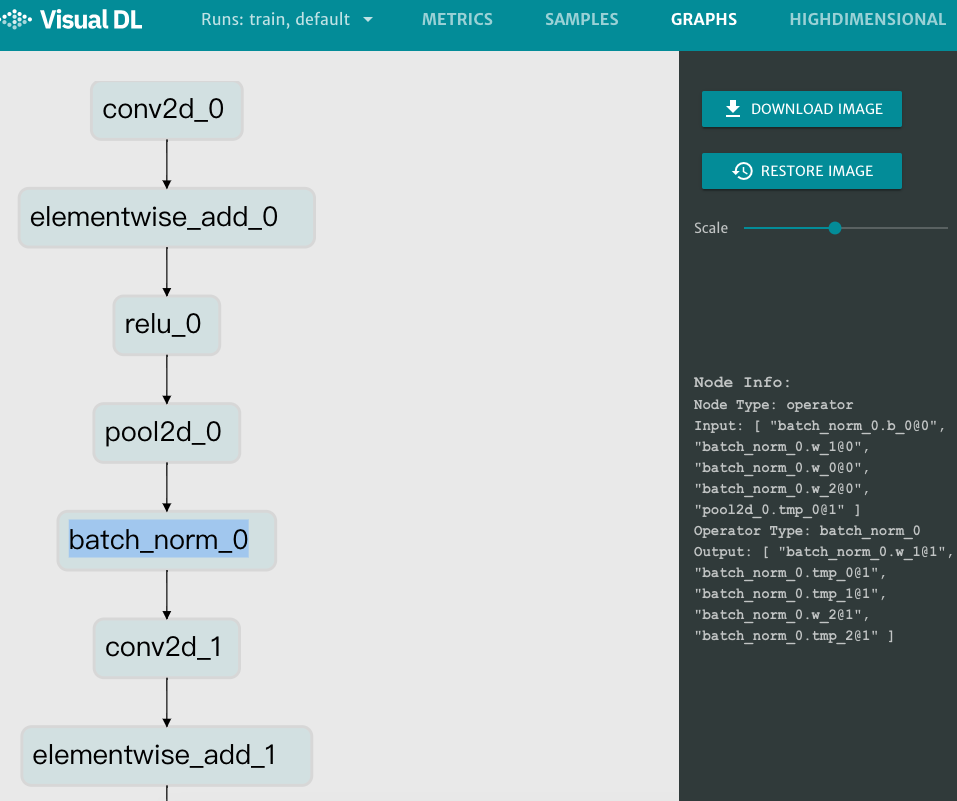
Figure 8. graph component displays the model structure of Lenet-5